Technical analysis is a method traders use to evaluate price movements and identify potential opportunities in financial markets. Instead of focusing on company fundamentals or macroeconomic data, it relies on charts, patterns, and historical price behavior.
For many traders, technical analysis becomes a practical framework—less about prediction, more about probability and timing.
What Is Technical Analysis and Why It Matters

At its core, technical analysis studies how price moves over time. The assumption is simple: market behavior often leaves patterns, and those patterns can offer clues about future movement.
Traders use it across markets, including stocks, forex, and cryptocurrencies. The goal isn’t certainty. It’s to improve decision-making with structured observation.
Core ideas behind technical analysis
- Price reflects all available information
- Trends tend to persist before reversing
- Historical patterns can repeat under similar conditions
These principles guide how traders interpret charts and indicators.
Key Tools Used in Technical Analysis
Technical analysis relies on a mix of visual tools and mathematical indicators.
Price charts
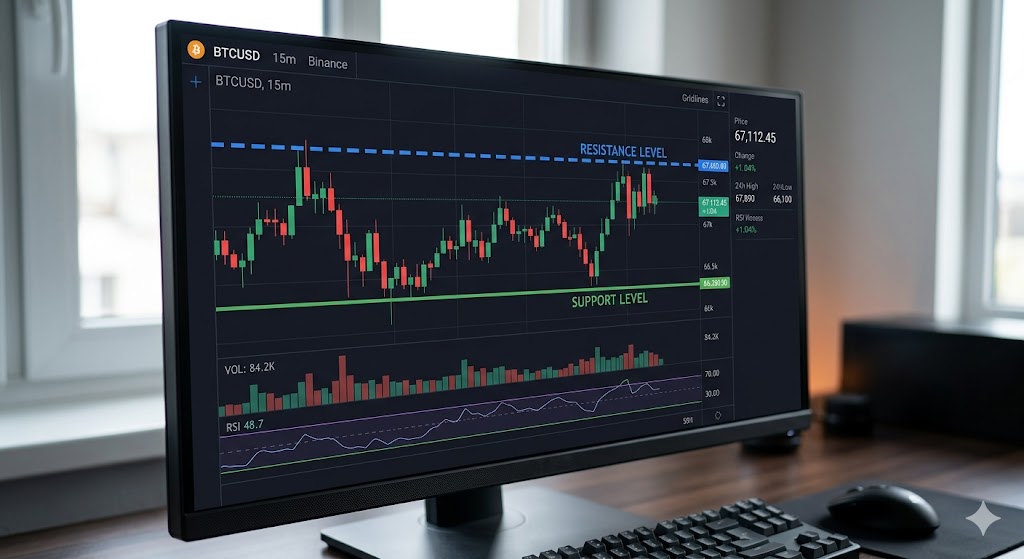
Candlestick charts are the most widely used. They show open, high, low, and close prices within a specific timeframe.
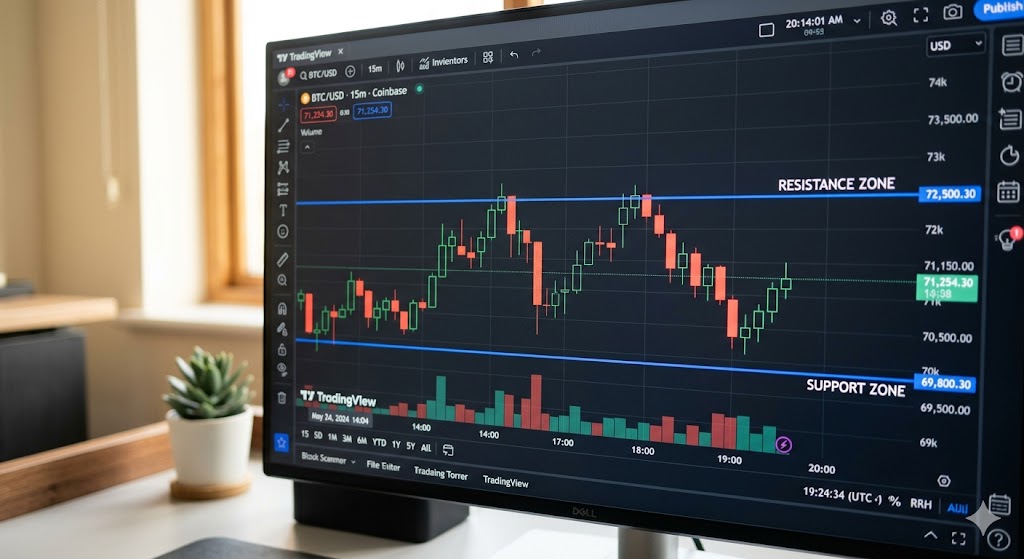
Trend lines and support levels
These help identify where prices tend to pause or reverse.
Indicators
Tools like moving averages, RSI, and MACD provide additional signals about momentum and trend strength.
Common indicator example
y = \frac{1}{n} \sum_{i=1}^{n} P_i
This represents a simple moving average, often used to smooth price data and highlight overall direction.
Types of Technical Analysis Strategies

Different traders use technical analysis in different ways, depending on their goals.
Trend following
Focuses on identifying and riding sustained price movements.
Range trading
Involves buying at support and selling at resistance within a stable price range.
Breakout trading
Targets moments when price moves beyond established levels, often with increased momentum.
Scalping
Short-term trades that aim to capture small price changes multiple times a day.
Each approach comes with its own pace, risk level, and required attention.
Comparison of Popular Indicators
| Indicator | Purpose | Best Use Case |
|---|---|---|
| Moving Average | Identify trend direction | Longer-term trend analysis |
| RSI (Relative Strength Index) | Measure overbought or oversold conditions | Timing entries and exits |
| MACD | Track momentum shifts | Confirming trend changes |
| Bollinger Bands | Measure volatility | Identifying price extremes |
No single indicator works in isolation. Most traders combine tools to reduce false signals.
Pro Insight
Technical analysis works best when used as a decision framework—not a prediction tool. Traders who rely on a single indicator often face inconsistent results. Combining price structure, trend context, and confirmation signals tends to produce more balanced outcomes.
Common Mistakes in Technical Analysis
Even experienced traders can fall into avoidable patterns.
Overloading charts with indicators
Too many signals can create confusion rather than clarity.
Ignoring market context
Price patterns can behave differently during high volatility or major news events.
Chasing late signals
Entering trades after a move is already extended increases risk.
Lack of consistency
Switching strategies too often makes it difficult to evaluate what works.
Quick Tip
Start with one or two indicators and learn them deeply. Mastery of a simple setup is often more effective than juggling multiple complex tools.
Real-World Micro Scenario
A trader notices a stock consistently bouncing off a support level while RSI indicates oversold conditions. Instead of entering immediately, they wait for confirmation—a reversal candlestick pattern.
That extra step helps reduce impulsive decisions and improves entry timing.
Frequently Asked Questions
What is technical analysis in simple terms?
It’s the study of price charts and patterns to help guide trading decisions.
Is technical analysis reliable?
It’s not guaranteed, but it can improve decision-making when used with discipline and risk management.
Can beginners learn technical analysis?
Yes, many start with basic chart patterns and simple indicators before advancing.
What is the best indicator for technical analysis?
There isn’t a single best indicator. Effectiveness depends on how it’s used and combined with other tools.
Does technical analysis work in crypto markets?
Yes, many traders apply it to crypto due to the market’s strong price-driven behavior.
Conclusion
Technical analysis offers a structured way to interpret market behavior. While it doesn’t eliminate risk, it provides a framework that helps traders make more informed and consistent decisions.
By focusing on patterns, trends, and confirmation signals, traders can better navigate both short-term movements and longer-term opportunities.
Trusted U.S. Resources
https://www.investor.gov
https://www.sec.gov
https://www.finra.org
https://www.cftc.gov
This article is for general informational purposes only and does not provide legal, financial, medical, or professional advice. Policies, rates, and regulations may change over time.