
Stock charts are one of the most practical tools for understanding how a market behaves over time. Whether you’re tracking a single company or scanning for opportunities, charts translate price data into patterns that are easier to interpret.
For many investors, charts aren’t just visual aids—they’re decision tools.
What Are Stock Charts and Why They Matter

A stock chart shows how a stock’s price changes over a specific period. It can display minutes, days, months, or even years of data, depending on your focus.
Charts matter because they help answer key questions:
- Is the stock trending up or down?
- Where do buyers and sellers typically step in?
- Is momentum increasing or fading?
Instead of relying on guesswork, charts give structure to market observation.
Types of Stock Charts Explained
There isn’t just one way to view price data. Different chart types highlight different insights.
Line chart
Simple and clean. It connects closing prices over time and is often used for long-term views.
Bar chart
Shows open, high, low, and close prices. More detailed than a line chart.
Candlestick chart
The most widely used format. It visually shows price movement and sentiment within each time period.
Key Elements Inside a Stock Chart
Understanding a chart requires knowing its core components.
Trend direction
Uptrend, downtrend, or sideways movement.
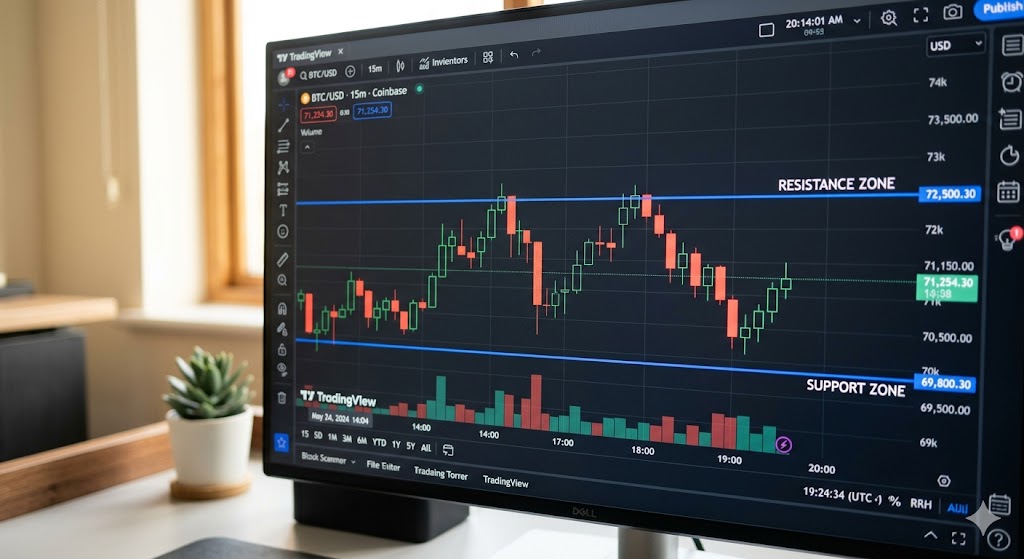
Support and resistance
Levels where price tends to stop falling or rising.
Volume
Indicates how many shares are traded—often confirming the strength of a move.
Timeframe
Short-term traders may use minutes or hours, while long-term investors focus on daily or weekly charts.
Comparison of Chart Types
| Chart Type | Best For | Limitation |
|---|---|---|
| Line Chart | Long-term trends | Limited detail |
| Bar Chart | Detailed price action | Less intuitive visually |
| Candlestick | Pattern recognition | Requires learning patterns |
Each type serves a purpose. Many traders rely on candlestick charts for daily decisions while using line charts for broader context.
Pro Insight
The timeframe you choose can completely change your perspective. A stock may look volatile on a 5-minute chart but stable on a daily chart. Experienced traders often analyze multiple timeframes before making a decision.
How to Read Stock Charts Step by Step
Reading charts becomes easier when broken into a simple process.
1. Identify the trend
Look at the overall direction before focusing on details.
2. Mark key levels
Support and resistance often guide price behavior.
3. Watch volume changes
Strong moves with high volume tend to be more reliable.
4. Look for patterns
Common formations like breakouts or reversals can provide context.
Quick Tip
Avoid zooming in too much too quickly. Start with a broader timeframe to understand the bigger picture, then narrow down for precise entry points.
Real-World Micro Scenario
An investor notices a stock steadily rising over several weeks. On the daily chart, it pulls back slightly to a previous support level while volume decreases.
Instead of reacting to short-term noise, the investor waits for confirmation of a bounce—aligning the trade with the overall trend rather than fighting it.
Common Mistakes to Avoid
Even simple charts can be misread without discipline.
Overanalyzing small movements
Short-term noise can distract from the main trend.
Ignoring volume
Price movement without volume can be misleading.
Forcing patterns
Not every chart forms a clear signal.
Switching timeframes too often
This can create confusion instead of clarity.

Frequently Asked Questions
What is the best stock chart for beginners?
Line charts are the easiest to understand, but many beginners quickly transition to candlestick charts for more detail.
How do I read a stock chart quickly?
Start by identifying the trend, then look at key levels and volume to confirm price movement.
Are stock charts useful for long-term investing?
Yes, especially for identifying trends and entry points, even if fundamentals drive long-term decisions.
What timeframe should I use for stock charts?
It depends on your strategy. Short-term traders use minutes or hours, while investors often use daily or weekly charts.
Do stock charts predict the future?
No. They help analyze probabilities based on past behavior, not guarantee outcomes.
Conclusion
Stock charts turn complex market data into something visual and actionable. While they don’t remove uncertainty, they provide a structured way to understand price movement and make more informed decisions.
With practice, reading charts becomes less about memorizing patterns and more about recognizing context. That shift often makes the biggest difference.
Trusted U.S. Resources
https://www.sec.gov
https://www.investor.gov
https://www.finra.org
https://www.nyse.com
This article is for general informational purposes only and does not provide legal, financial, medical, or professional advice. Policies, rates, and regulations may change over time.